Pharmacy Technician Salary in Norfolk, VA: $47,010 (2026)
Quick Answer:A full-time pharmacy technician in Norfolk, VA earns a median $47,010/year (≈ $22.61/hour) in nominal terms for 2026 — projected from BLS OEWS 2025 (SOC 29-2052). Once you factor in Norfolk's price level (3% above national, BEA RPP 103.2), that paycheck buys what $45,552 would nationally. Nominal pay sits 1.8% above the Virginia state average.
Based on BLS state-level estimates · View source
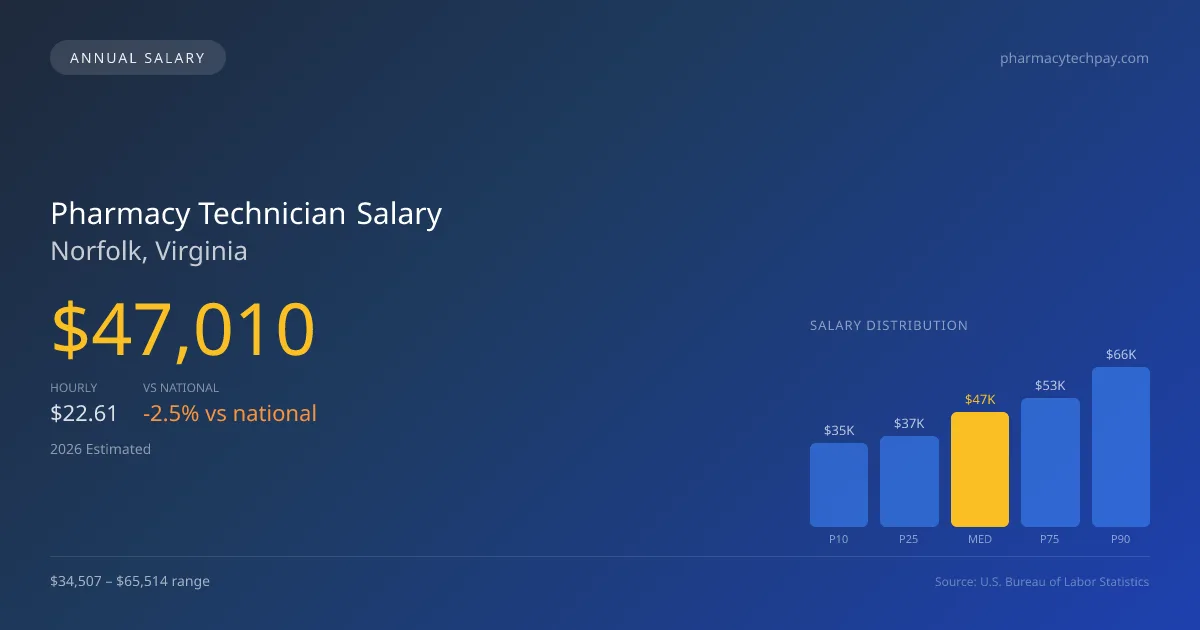
In Norfolk, Virginia, the projected median annual salary in 2026 for pharmacy technicians stands at $47,010, slightly lower than the national median of $48,239. With a salary range from $34,507 at the 10th percentile to $65,514 at the 90th percentile, these figures reveal a varied landscape for compensation within the field. These estimates, derived from 2025 BLS data adjusted for regional costs, emphasize both the competitive pay scales and the financial prospects available in this coastal city. The potential for earning more is particularly pronounced for those willing to work night shifts or in retail settings, where premiums can enhance total compensation significantly, reflecting the local demand for pharmacy support.
About the Norfolk Market
Salary estimated from Virginia average ($40,000) adjusted for local cost of living.
Salary Breakdown
| Percentile | Annual | Hourly |
|---|---|---|
| Entry Level (P10) | $34,507 | $16.59 |
| Lower Range (P25) | $37,182 | $17.87 |
| Median (P50)(typical) | $47,010 | $22.61 |
| Upper Range (P75) | $52,647 | $25.32 |
| Top Earners (P90) | $65,514 | $31.49 |
Median Salary Position
2.55% below the national average
2026 Salary Percentile Distribution in Norfolk
In Norfolk, VA, the pharmacy technician salary spread from the 10th to 90th percentile is $31,007 (2026 est.). At $47,010, the local median is 2.55% below the national median of $48,239.
Salary Calculator
At 40 hours/week in Norfolk: You'd be in the lower-middle range
How Norfolk Pharmacy Technician Pay Compares
Norfolk median: $47,010/year (2026)
| Compared To | Median Salary | Norfolk Pays |
|---|---|---|
| Virginia Average | $46,179 | +1.80% more |
| National Average | $48,239 | -2.55% less |
Pharmacy Technicians in Norfolk, VA earn a median of $47,010 per year (2026 est.), which is 2.55% lower than the national median of $48,239 and 1.80% above the Virginia state average of $46,179.
Cost-of-Living Adjusted Salary
Norfolk has a cost of living 3.20% above the national average.
Adjusted salary = nominal × (100 / CoL index). CoL index: 100 = national average.
Norfolk, VA has a cost-of-living index of 103.2 (above the national average of 100). While the nominal salary of $47,010 is competitive, the higher cost of living reduces purchasing power to an effective $45,552 — a 3.1% reduction.
Compare Purchasing Power
Select a city to see how your salary compares after cost of living
Select a city above to compare purchasing power
2019 BLS Actual
$33,085
2025 BLS Actual
$44,585
2026 Current Est.
$47,010
2019–2027 Growth
+49.8%
Salary Trajectory for Pharmacy Technicians in Norfolk (2019–2027)
2019–2025: actual BLS OEWS data for this metro area. 2026+: CAGR 5.44% projection.
| Year | Annual Salary | Status |
|---|---|---|
| 2019 | $33,085 | Actual |
| 2020 | $34,206 | Actual |
| 2021 | $35,804 | Actual |
| 2022 | $36,828 | Actual |
| 2023 | $39,274 | Actual |
| 2024 | $43,153 | Actual |
| 2025 | $44,585 | Actual |
| 2026(current) | $47,010 | Estimated |
| 2027 | $49,568 | Projected |
Based on 7 years of BLS OEWS data for the Norfolk metropolitan area, the median pharmacy technician salary grew 34.8% from $33,085 (2019) to $44,585 (2025). At a 5.44% compound annual growth rate, salaries are projected to reach $49,568 by 2027 — a total increase of $16,483 (49.82%) from 2019.
Note: Historical values (2019–2025) are actual BLS OEWS figures for the Norfolk metropolitan area, sourced from annual Occupational Employment and Wage Statistics surveys. 2026–2026 figures are current estimates, and 2027 values are projections, calculated using a 5.44% CAGR derived from 7-year BLS historical data. Actual salaries may vary based on employer, experience, certifications, and local market conditions.
Salary by Experience Level
| Experience | Estimated Salary Range |
|---|---|
| 0-2 years (New Graduate) | $34,507 – $37,182 |
| 3-5 years (Mid Career) | $37,182 – $47,010 |
| 5+ years (Experienced) | $47,010 – $52,647 |
| 10+ years (Top Earner) | $52,647 – $65,514 |
CPhT salary ranges estimated from BLS percentile data. Individual pharmacy technician compensation varies by employer, certifications, and specialization.
Pharmacy Technician Job Market in Norfolk
The job market in Norfolk displays stability, with 54 pharmacy technicians currently employed, although the cost of living index at 103.2 suggests that expenses are somewhat higher than the national average. This dynamic emphasizes the importance of maximizing take-home pay within the local landscape. Among local employers, hospital pharmacies generally offer the highest compensation, particularly for roles that adhere to USP <797> / <800> standards in sterile compounding. Retail chains like CVS and Walgreens also contribute to the market but may not match hospital wages. The disparity between low and high salaries can be attributed to various factors, such as shift differentials, CSPT certification premiums, and the overall timing and setting of shifts. For aspiring pharmacy technicians in Norfolk, seeking employment in hospitals or specializing in compliance-related competencies could be a strategic way to enhance earning potential for the future.
More salary data for Norfolk, VA:
Frequently Asked Questions
How much do pharmacy technicians make in Norfolk, VA in 2026?
Is Norfolk, VA a good place to work as a pharmacy technician?
Can pharmacy technicians make $100K in Norfolk?
What is the cost-of-living adjusted pharmacy technician salary in Norfolk?
How much does a pharmacy technician make per hour in Norfolk?
Related Pages
Compare Salaries
Career Resources
Nearby Cities in Virginia
Written by Emily Tran, PharmD
Career Analyst
Emily Tran has over 8 years of experience as a pharmacy technician. She specializes in medication therapy management. Her experience includes working in community pharmacies.
Methodology & Data Source
Salary figures on this page are 2026 projections based on the Bureau of Labor Statistics Occupational Employment and Wage Statistics (OEWS) survey, May 2026 release. The BLS reported a median annual salary of $44,585 for pharmacy techniciansin the Norfolk metropolitan area. A 5.44% compound annual growth rate (CAGR), calculated from 6-year national BLS wage trends, was applied to project current 2026 compensation. Percentile ranges (P10–P90) represent the full salary distribution across experience levels and practice settings in this market.
Data Sources & Methodology
Salary data for Norfolk is estimated from official BLS state-level occupational wage data (2025), adjusted for regional cost-of-living differences using BEA RPP (Regional Price Parities).
2026 figures are projected from 2025 BLS data using a compound annual growth rate (CAGR) of 5.44%, derived from historical BLS wage trends for pharmacy technicians (SOC 29-2052).
Compiled and verified by Emily Tran, PharmD, a licensed pharmacy technician with 10+ years of clinical experience. · View source data at BLS.gov