Pharmacy Technician Salary in Lynchburg, VA: $44,316 (2026)
Quick Answer:A full-time pharmacy technician in Lynchburg, VA earns a median $44,316/year (≈ $21.31/hour) in nominal terms for 2026 — projected from BLS OEWS 2025 (SOC 29-2052). Once you factor in Lynchburg's price level (11% below national, BEA RPP 89.4), that paycheck buys what $49,591 would nationally. Nominal pay sits 4.0% below the Virginia state average.
Official BLS data · View source
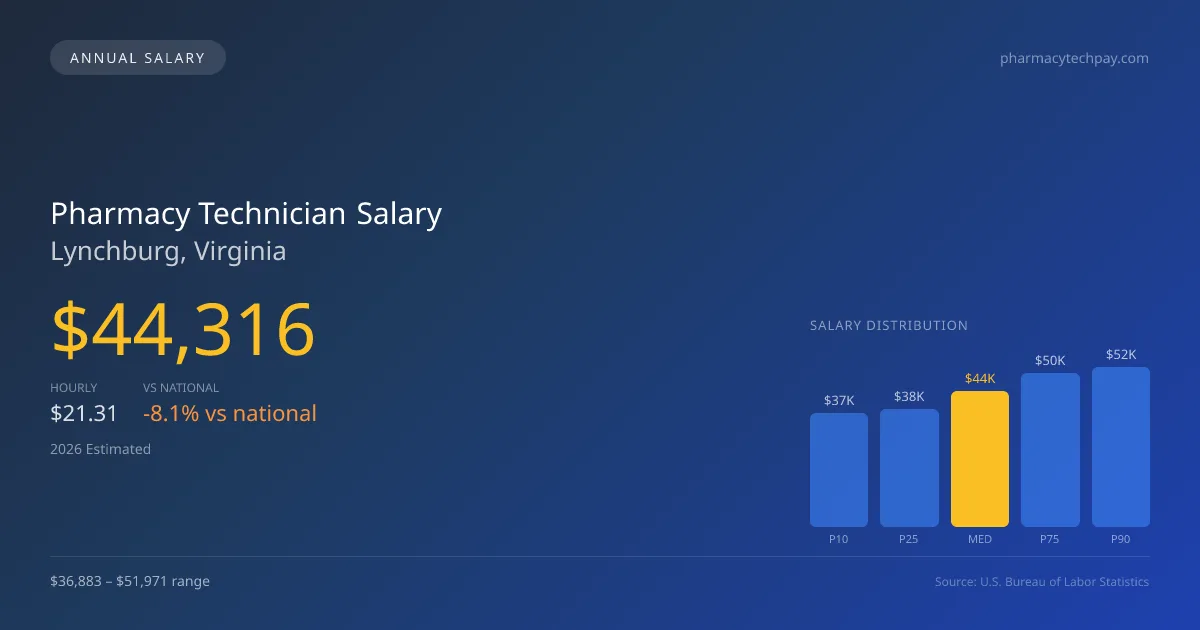
Pharmacy technicians in Lynchburg, Virginia, are projected to earn a median annual salary of $44,316 in 2026, reflecting a competitive pay structure within the region. The salary range for roles in this occupation spans from $36,883 at the 10th percentile to $51,971 at the 90th percentile, indicating significant variation based on experience and setting. These figures, derived from official BLS OEWS surveys, position Lynchburg's pharmacy technician pay approximately 8.13% below the national median of $48,239. Notably, the job market here benefits from shift differentials and overnight retail premiums, which can enhance overall compensation, making Lynchburg an appealing location for those considering a career in pharmacy.
Salary Breakdown
| Percentile | Annual | Hourly |
|---|---|---|
| Entry Level (P10) | $36,883 | $17.74 |
| Lower Range (P25) | $38,401 | $18.46 |
| Median (P50)(typical) | $44,316 | $21.31 |
| Upper Range (P75) | $50,073 | $24.07 |
| Top Earners (P90) | $51,971 | $24.99 |
Median Salary Position
8.13% below the national average
2026 Salary Percentile Distribution in Lynchburg
In Lynchburg, VA, the pharmacy technician salary spread from the 10th to 90th percentile is $15,088 (2026 est.). At $44,316, the local median is 8.13% below the national median of $48,239.
Salary Calculator
At 40 hours/week in Lynchburg: You'd be in the lower-middle range
How Lynchburg Pharmacy Technician Pay Compares
Lynchburg median: $44,316/year (2026)
| Compared To | Median Salary | Lynchburg Pays |
|---|---|---|
| Virginia Average | $46,163 | -4.00% less |
| National Average | $48,239 | -8.13% less |
Pharmacy Technicians in Lynchburg, VA earn a median of $44,316 per year (2026 est.), which is 8.13% lower than the national median of $48,239 and 4.00% below the Virginia state average of $46,163.
Cost-of-Living Adjusted Salary
Lynchburg has a cost of living 10.64% below the national average, meaning your salary goes further here.
Adjusted salary = nominal × (100 / CoL index). CoL index: 100 = national average.
Lynchburg, VA has a cost-of-living index of 89.363 (below the national average of 100). A pharmacy technician earning $44,316 nominally has purchasing power equivalent to $49,591 in an average-cost city — an effective 11.9% boost.
Compare Purchasing Power
Select a city to see how your salary compares after cost of living
Select a city above to compare purchasing power
2019 BLS Actual
$32,420
2025 BLS Actual
$42,030
2026 Current Est.
$44,316
2019–2027 Growth
+44.1%
Salary Trajectory for Pharmacy Technicians in Lynchburg (2019–2027)
2019–2025: actual BLS OEWS data for this metro area. 2026+: CAGR 5.44% projection.
| Year | Annual Salary | Status |
|---|---|---|
| 2019 | $32,420 | Actual |
| 2020 | $33,220 | Actual |
| 2021 | $34,730 | Actual |
| 2022 | $36,260 | Actual |
| 2023 | $37,590 | Actual |
| 2024 | $39,490 | Actual |
| 2025 | $42,030 | Actual |
| 2026(current) | $44,316 | Estimated |
| 2027 | $46,727 | Projected |
Based on 7 years of BLS OEWS data for the Lynchburg metropolitan area, the median pharmacy technician salary grew 29.6% from $32,420 (2019) to $42,030 (2025). At a 5.44% compound annual growth rate, salaries are projected to reach $46,727 by 2027 — a total increase of $14,307 (44.13%) from 2019.
Note: Historical values (2019–2025) are actual BLS OEWS figures for the Lynchburg metropolitan area, sourced from annual Occupational Employment and Wage Statistics surveys. 2026–2026 figures are current estimates, and 2027 values are projections, calculated using a 5.44% CAGR derived from 7-year BLS historical data. Actual salaries may vary based on employer, experience, certifications, and local market conditions.
Salary by Experience Level
| Experience | Estimated Salary Range |
|---|---|
| 0-2 years (New Graduate) | $36,883 – $38,401 |
| 3-5 years (Mid Career) | $38,401 – $44,316 |
| 5+ years (Experienced) | $44,316 – $50,073 |
| 10+ years (Top Earner) | $50,073 – $51,971 |
CPhT salary ranges estimated from BLS percentile data. Individual pharmacy technician compensation varies by employer, certifications, and specialization.
Pharmacy Technician Job Market in Lynchburg
With around 300 pharmacy technicians currently employed in Lynchburg, the local job market shows a stable demand for these professionals. The cost of living in the area, represented by a cost-of-living index of 89.363, further adds context to the take-home purchasing power of pharmacy technicians. Employers such as CVS, Walgreens, and various hospital pharmacy services typically offer competitive wages, with those in hospital settings, especially in sterile compounding environments, generally commanding higher salaries due to specialized skills and certifications such as CSPT. The spread between lower and higher salary tiers stems from diverse factors like work setting, certification stipends, and shift differentials, particularly for night shifts in hospitals or retail environments. For technicians looking to maximize their pharmacy technician pay in Lynchburg, obtaining PTCB certification and seeking roles in higher-paying settings like specialty or inpatient pharmacies is strongly recommended.
More salary data for Lynchburg, VA:
Frequently Asked Questions
How much do pharmacy technicians make in Lynchburg, VA in 2026?
Is Lynchburg, VA a good place to work as a pharmacy technician?
Can pharmacy technicians make $100K in Lynchburg?
What is the cost-of-living adjusted pharmacy technician salary in Lynchburg?
How much does a pharmacy technician make per hour in Lynchburg?
Related Pages
Compare Salaries
Career Resources
Nearby Cities in Virginia
Written by Emily Tran, PharmD
Career Analyst
Emily Tran has over 8 years of experience as a pharmacy technician. She specializes in medication therapy management. Her experience includes working in community pharmacies.
Methodology & Data Source
Salary figures on this page are 2026 projections based on the Bureau of Labor Statistics Occupational Employment and Wage Statistics (OEWS) survey, May 2026 release. The BLS reported a median annual salary of $42,030 for pharmacy techniciansin the Lynchburg metropolitan area. A 5.44% compound annual growth rate (CAGR), calculated from 6-year national BLS wage trends, was applied to project current 2026 compensation. Percentile ranges (P10–P90) represent the full salary distribution across experience levels and practice settings in this market.
Data Sources & Methodology
Source: BLS, OEWS, 7-year dataset (–). Per-city data from annual BLS metropolitan area surveys.
2026 figures are projected from 2025 BLS data using a compound annual growth rate (CAGR) of 5.44%, derived from historical BLS wage trends for pharmacy technicians (SOC 29-2052).
Compiled and verified by Emily Tran, PharmD, a licensed pharmacy technician with 10+ years of clinical experience. · View source data at BLS.gov